With the advent of AI and machine learning, some of the most complicated problems in industry have been not only understood but optimized. How can your business utilize these new techniques, and why are they so important?First, what is machine learning and why is it important?
Machine learning is defined as
“the scientific study of algorithms and statistical models to perform a specific task.” Machine learning and AI when implemented in business systems can not only automate many business processes, but also bring to light unknown patterns, predictors, and take analysis to a whole new level. Used incorrectly; overfitting models or incorrectly characterizing the problem is frequent and is something even the most talented data scientists struggle with.
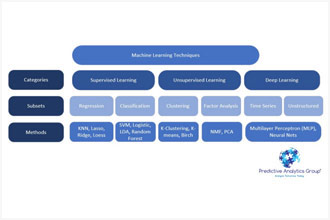
First let’s go through a general overview of Machine learning techniques, then we’ll go through some examples. Machine learning can be broken into 3 main groups with multiple subsets as specified in the chart below.
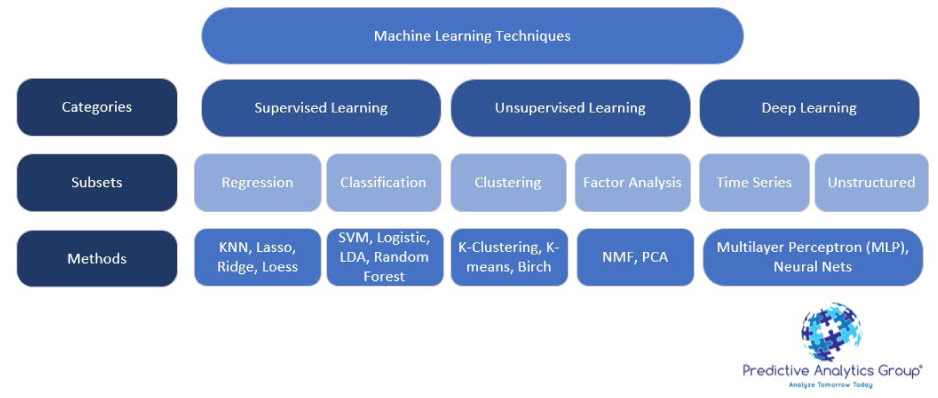 Supervised learning algorithms
 find the relationship of variables that has the most predictive power, based on historical data. The two methods are regression and classification methods.
- Regression-based supervised learning methods try to predict outputs based on input variables.
Unsupervised learning algorithms attempt to understand the structure of data and to identify the main drivers behind it. This is based on clustering of variables, and factor input analysis.
Deep learning uses multi-layered neural networks to analyze trends and is an attempt to artificially recreate human intelligence.
- Deep learning is used best for unstructured large data sets. A deep learning model could use a hypothetical financial data series to estimate the probability of a stock crash, or market correction.1
Reinforcement learning encourages algorithms to explore and find the most profitable trading strategies representative of AI.
This all sounds great, but what is a relevant example? Imagine a machine is given an entire set of returns from assets and must decide which of 200 variables are dependent and independent as well as their interactions. In this case using a deep learning algorithm would be appropriate and could lead to insights our minds couldn’t come to due to the complexity of a given data set.
Let’s use some of these techniques on an applicable problem: Many Universities base their cost structure on projections of Admissions yield (matriculation rate) or the expected number of students who will accept an offer of admission for the next class. If a University is not able to accurately predict the admissions yield within a certain error range, there could be significant negative impacts to the University. This is due to high fixed costs and expected expenses for students who do not accept their offer.
23
Given an easily accessible data set
4 from Kaggle (a data science collaboration platform), lets run some basic algorithms to see what insights we understand in predicting Admissions yield.
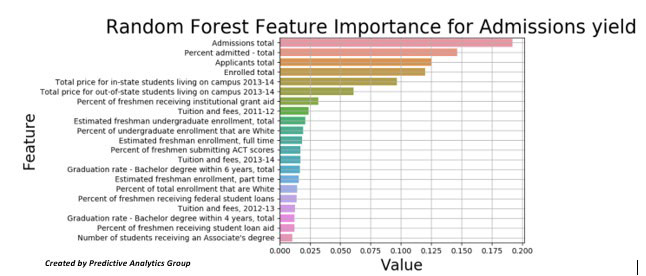
Since there are over 50 other variables in this data set, let’s run a random forest classifier to see which variables have the greatest impact on admissions yield. This is a common practice to cut down convoluted data sets with many columns that are often correlated/colinear with each other.
Random forests or random decision forests are an ensemble learning method for classification, regression and other tasks that operate by constructing a multitude of decision trees at training time and outputting the class that is the mode of the classes (classification) or mean prediction (regression) of the individual trees. Random decision forests correct for decision trees’ habit of overfitting to their training set.
1Butcher, Sarah. “JPMorgan’s Massive Guide to Machine Learning Jobs in Finance.” EFinancialCareers. May 05, 2018. Accessed May 05, 2019. https://news.efinancialcareers.com.
2Brad, Weiner. “Can Artificial Intelligence Automate College Admissions?” Capture Higher Ed. May 02, 2019. Accessed May 05, 2019. https://capturehighered.com
3Baig, Edward C. “Who’s Going to Review Your College Applications – a Committee or a Computer?” USA Today. December 03, 2018. Accessed May 05, 2019. https://www.usatoday.com.
4 https://www.kaggle.com/samsonqian/college-admissions
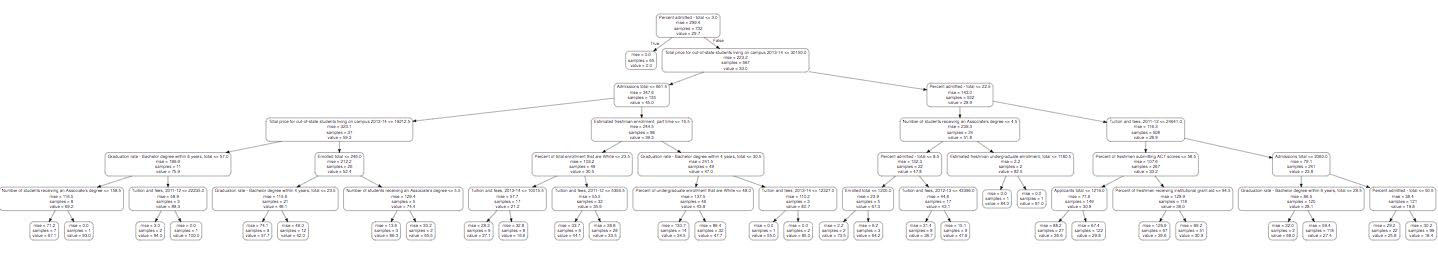
In this random forest there is an aggregation of 1000 decision trees; one can be seen below (cut down to a max depth of 7 nodes)
We can also use the random forest model as a predictor. Using a cross validation training split, we can train the model and test it with a subset (around 10%) of our original data set.
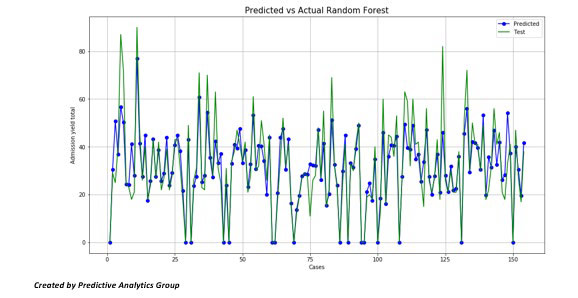
For 153 tests, we predict with 78% accuracy the admissions yield based upon the 23 variables we are using in the total dataset.
Before we get ahead of ourselves, let’s do some basic exploratory data analysis for each variable and see if there are any obvious correlations before we run prediction algorithms.
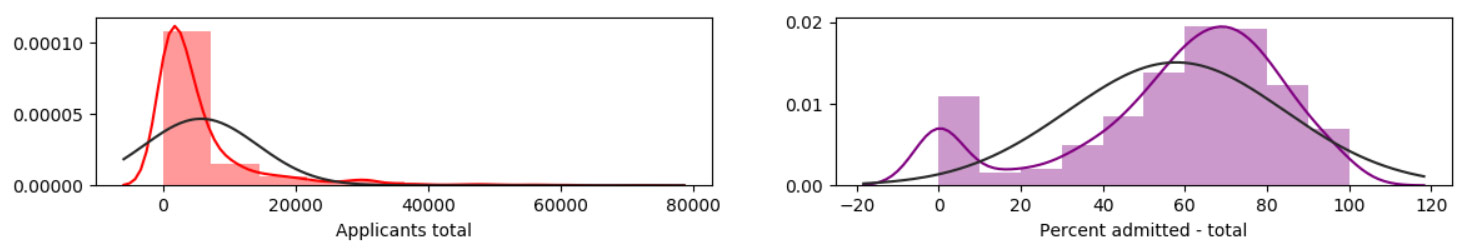
As we can see, the average amount of applicants hover around 5,000, and this is in comparison to the average percent admitted which hovers around 75%.
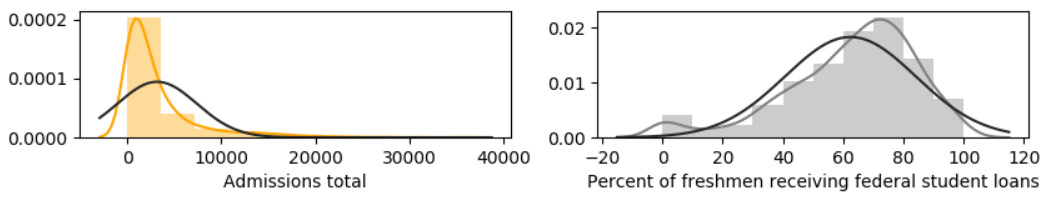
Most freshman are receiving student loans
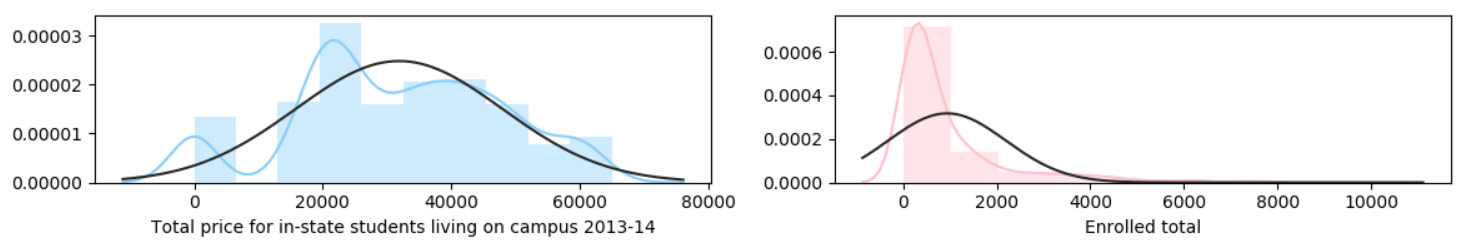
Total instate pricing hovers around $20,000 but also goes as high as $70,000
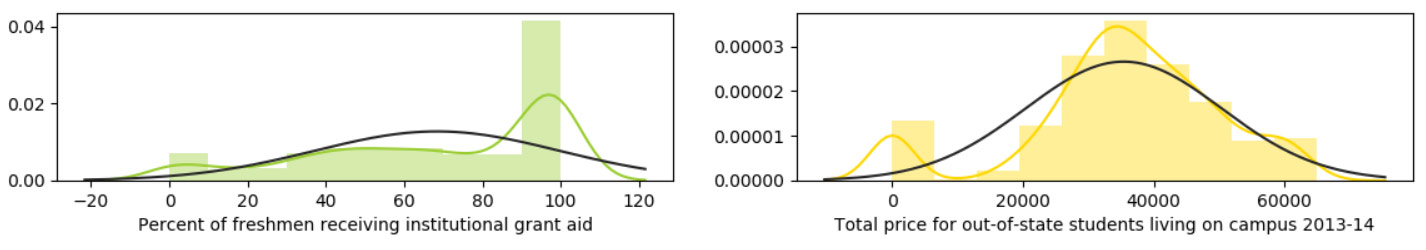
We can also see that the average university gives 75% of freshmen grant aid, and that the average price for out of state students is around $20,000 more than in state.
Many of these relationships are to be expected but will help us understand possible correlations.
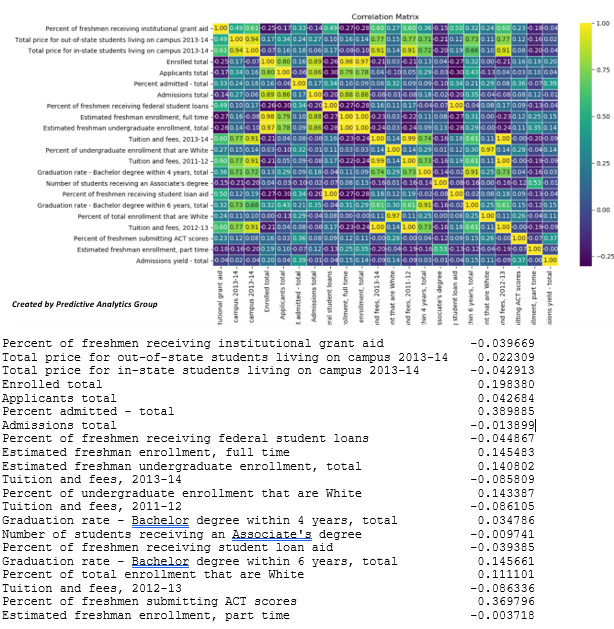
Many variables are heavily correlated and most have to do with total applicants and enrolled total, something we would assume. For admissions yield there are few variables that seem to have a high impact besides percent admitted total, which is to be expected, but there seem to be high correlations with percent of students submitting ACT scores as well as graduation rate and cost of attendance.
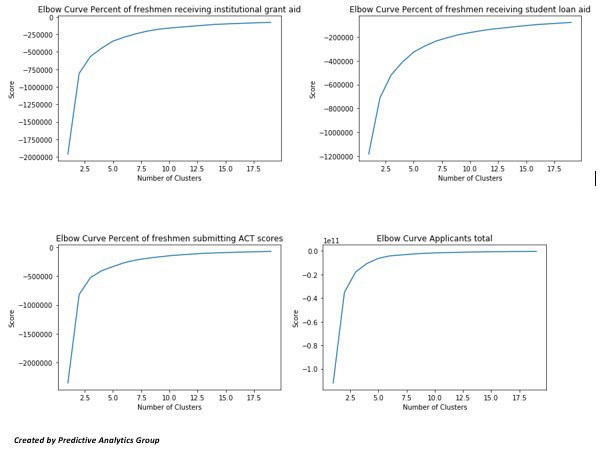
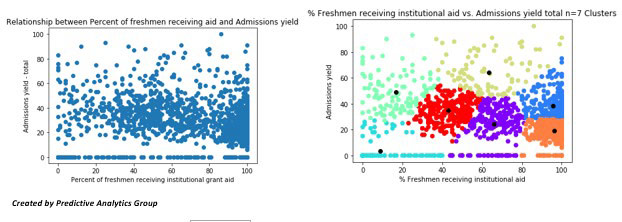
We can run a few Machine learning methods to see how accurately they predict Admissions yield. Let’s start out with an unsupervised learning process K-Clustering.
K-means clustering aims to partition n observations into k clusters in which each observation belongs to the cluster with the nearest mean, allowing us to understand how our data clusters as well as run further analysis.
We first need to find out the optimal number of clusters to use; we can do this given an elbow curve. This will show us the optimal score based upon the number of clusters. As we can see these plateaus around 5 clusters for some, and around 7 or 10 for others.
Now we can visualize the relationship between the two variables with a few graphs and a KNN regression to model and fit the data.
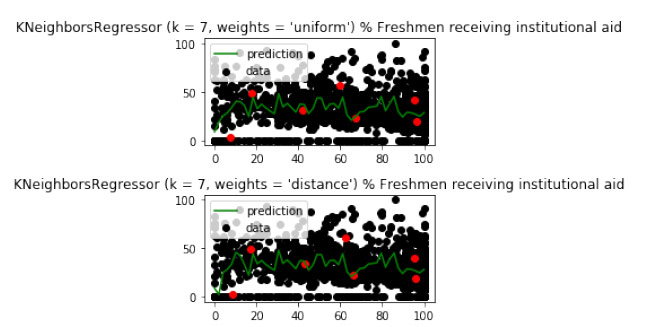
Let’s try this with a few more variables as well:
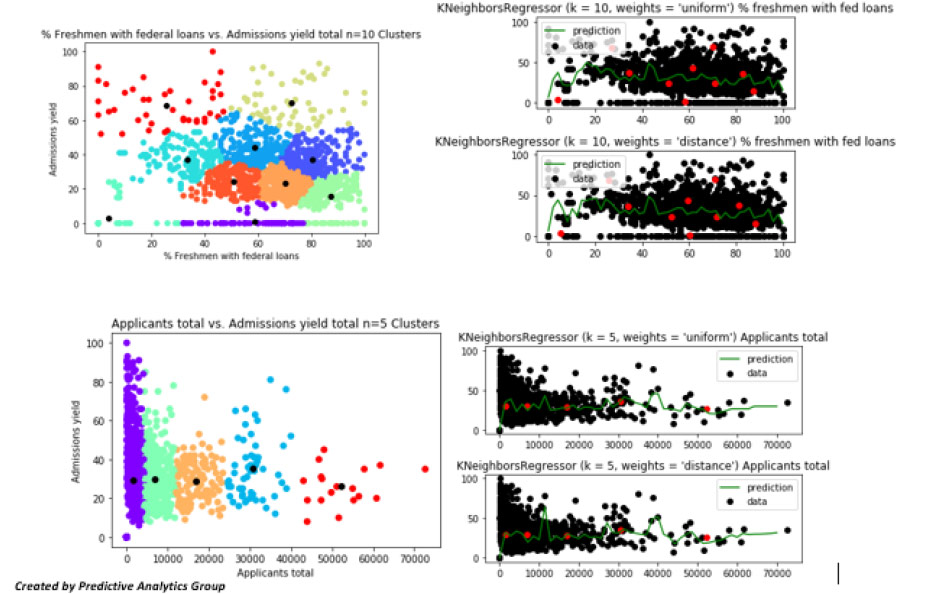
We can see the different clusters and see the red dots in the K nearest neighbors’ algorithm with the same clusters in red to predict admissions yield using both a uniform and distance method.
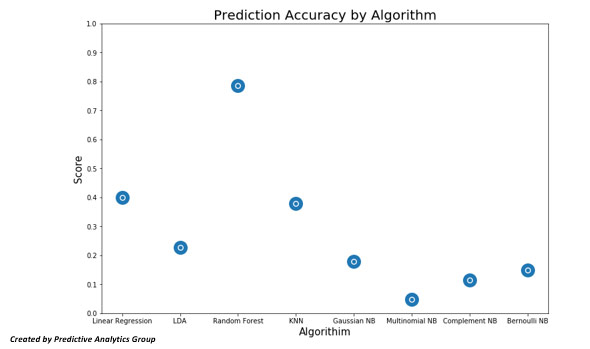
These predict the general trend but not as well as we would like, each one scoring around 38% accuracy. We can try a basic linear case
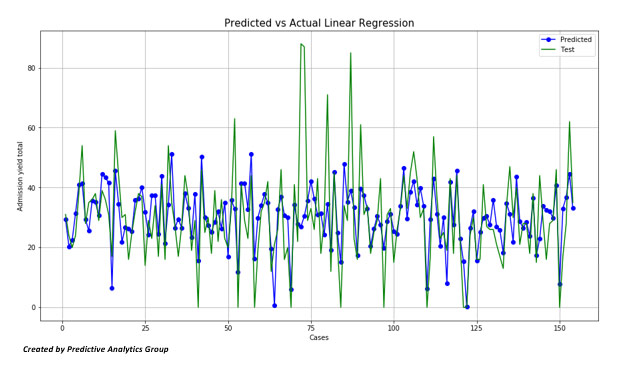
The linear case also seems to be accurate, although there could be a higher prediction / score
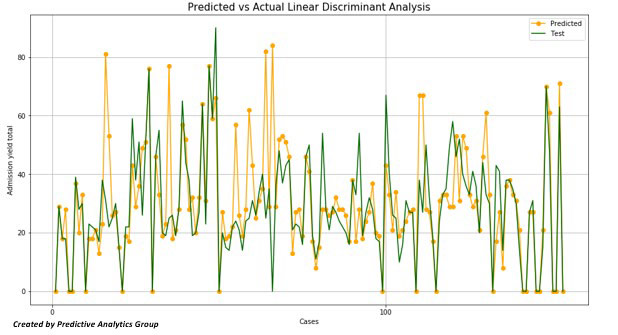
Two other methods we can try are Linear Discriminant Analysis although this gives us a poor fit.
The last models we’ll use are a few Naive Bayesian methods: Naive Bayes is a simple technique for constructing classifiers: models that assign class labels to problem instances, represented as vectors of feature values, where the class labels are drawn from some finite set. These predictions also failed to predict well.
Overall there is much information we’ve been able to obtain from this basic and general analysis with a few algorithms. There is so much more that can be done whether finding the right variables to optimize prediction capabilities, and many other variables and trends to understand and predict. But this is dependent on the timeline, budget and depth of the model needed.
Although this dataset is within the higher education hemisphere, these methods can be applied to any industry, as long as the proper checks and balances are in place. It’s important to know your data, but even more important to continue to learn new ways of interacting with it so you can obtain the best results.
Out of all the methods that we have used I would suggest using the Random forest regressor; it has the highest prediction accuracy and accounts for the large scale of this data set as well.
Using these different methods we have identified a few variables of interest that seem predictive of Admissions yield; “Applicants total”, “Percent of freshmen submitting ACT scores”, “Percent of freshmen receiving federal student loans”, “Total price for out-of-state students living on campus 2013-14”, and “Percent of freshmen receiving institutional grant aid.” Many of these variables make sense; price and aid should be highly correlated especially if the university is expensive. Next steps in this analysis would include optimizing you models, cutting down the number of variables used based upon qualitative research or expert insights.
Implementing the science of mathematics, statistics, and state of the art algorithms in order to uncover patterns and insights can reduce time and increase savings exponentially. It’s critical to understand both your data and the why behind it, as with the absence of the right models, techniques and questions, the explanatory power of the data is greatly diminished. Data analysis is incredible powerful and important; pairing the art with this science will bring your analysis to the next level, keep you on the cutting edge of the industry, ensure that your models are applicable in the real world and improve your speed to market.
If you would like to learn more about how these methods can be applied in your business, please contact Predictive Analytics Group at 844-SEEK-PAG.