Company: Small Footprint Casino
Challenge:
Casino was struggling with revenue generation from its Slot and Video Gaming machines. They recently went through a renovation and had organized their machines into 3 clustered areas within the main casino floor. They noticed their revenue significantly drop (12%) in the following three months of production. Its management team had full access to detailed data on a machine basis, including historical performance. They were looking to identify where they were seeing opportunity to improve floor layout plans or simple placement of machines.
PAG Solution:
PAG worked with the client to review the existing & historical data. We then spent two days onsite with several floor supervisors to walk through the current layout and review the previous layout.
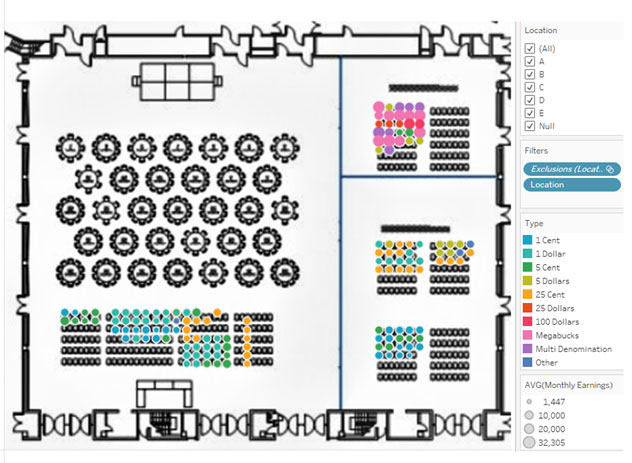
Stage 1 consisted of PAG evaluating the individual machine production and profitability, including constructing a generic floor layout with a heat map of the machine production. We then compared each machine’s recent performance to their historical trends.
Stage 2 included observing traffic flow of the customers during high traffic times on the Casino Floor. We also evaluated traffic flow during the slower times. We then created Business Intelligence (BI) reporting to show performance by machine by different casino floor traffic times.
Stage 3 allowed PAG to work with the Casino Management team to evaluate shifts in performance pre and post renovation and movement of machines. In addition, we were able to show them detailed statistics on their individual machine profitability and optimal location. Lastly, we were able to show the unreasonable lack of traffic flow that occurred in their clustering of machines, which caused many to go untouched.
Final recommendations included maintaining current renovation major changes while updating machine placement according to machine learning algorithms we created from the historical data (which occurred under 2 different floor plans and product placements). This allowed us to optimize customer flow from areas such as restrooms, restaurants, Poker Room, shops and other attractions. Here is a revised example of the heat map created, with removal of identifying marks, and slight movement of pieces to anonymize the Client:
Client Benefits:
- The new design and machine placement realized an improvement of 16.2% in revenue generation, after removing seasonality (improvement was 19.8%, which included seasonality over the summer months).
- Average time per session improved by 5%, while time away from machine improved by 7.1%. Data for this was based on individual customer’s who had their player cards inserted into machines only.
- PAG worked with the client to build ongoing automated reporting through our custom portals to continually track performance on a set of 10 metrics we established to assist the casino in optimizing profitability long-term.
- PAG has been engaged by the Casino for two subsequent projects since the implementation of the changes


